BiteSized Immunology: Experimental Techniques

Flow Cytometry
Flow cytometry is a powerful tool to analyse multiple parameters on an individual cell basis. Cell populations can be characterised using a combination of antigens both on the surface and intracellularly. There are a number of practical applications regularly used by immunologists including immunophenotyping, measuring intracellular cytokine production, cellular proliferation, assessing cell viability and analysis of cell cycle, rare events, stem cells and fluorescent proteins. Cell sorting based on flow cytometry is used to separate cells into populations of interest.
Flow cytometry overview
Flow cytometry technology is based on measurement of fluorescence associated with cells, typically for immunology detection of monoclonal antibodies coupled to fluorochromes e.g. FITC anti-CD3, or dilution of fluorescent dyes such as CFSE during proliferation.
The basics of flow cytometry technology
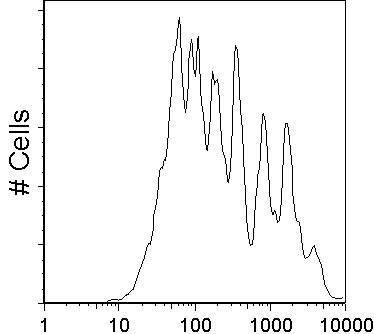
Essentially flow cytometers run cells past a laser a single cell at a time, detect fluorescence and light scattered from the cell and record this information for subsequent analysis.
A number of lasers are commonly used and are named after the emission wavelength or colour: 488nm (Blue argon laser), 633nm (Red HeNe laser), 405nm (Violet laser), 532nm (Green laser), 360nm (UV laser).
Fluorochromes which are preferentially excited on only one of the lasers are available with new flurochromes and dual-conjugated i.e. ‘tandem’ dyes being commercially produced. Some common fluorochromes are FITC, PE, PerCP, APC and Pacific Blue, commonly used tandem fluorochromes include PerCP-Cy5.5 and APC-Cy7.
Flow cytometry for the immunologist
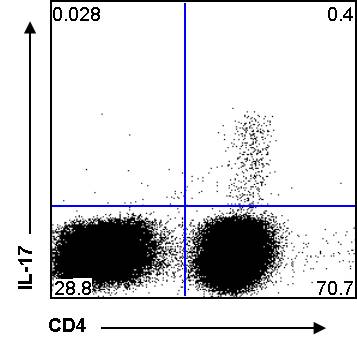
There are a wide variety of applications for flow cytometry in immunology, including tracking expansion of antigen-specific T cells by running a large total number of cells to detect a small percentage of specific cells. Increased information comes from staining for multiple antigenic markers. For example when investigating regulatory T cells, it may be useful to stain for a number of markers with a panel such as CD39-FITC, Foxp3-PE, CD4-PerCP, CD3-PeCy7, CD25-APC (antibody-fluorochrome).
It is important to have the correct controls to set up the flow cytometer and correctly compensate for any overlap in emission of each of the fluorochromes. These controls are unstained cells, single colour (i.e. each antibody at a time) and fluorescence minus one (FMO) where all antibodies in the panel are added to cells, removing a single antibody in turn.
© The copyright for this work resides with the author